Tests on version 2014 (v0.2)
The 2014 release of TrackBees project was the first release considered to be in a state capable of performing several tests of the system to validate its goals, like consumption, autonomy, theft detection and recovery of a stolen hive. This third post presents some experiences done with this release followed by the list of components that make this release. This post is a little bit longer because of the exposition of three experiences.
Motivation
One of the fundamental aspects that guided the design of the system was the autonomy of the system. Since the beginning of the project, the goal was to have autonomy in the order of months with the equipment in operation without having to recharge the battery. The solution adopted was to have a system consisting of two subsystems: subsystem 1 permanently powered on and subsystem 2 powered only in theft and monitoring scenarios.
While the instantaneous consumption of subsystem 1 remains stable and corresponds to 30uA, it was verified that the overall consumption of the system with subsystem 2 equally powered on is difficult to measure because the consumption presents differentiated values during the execution of the system control application.
Under release 2014, the solution has reached a state of hardware and control application that has enabled testing to validate system autonomy and overall consumption. The 2014 release corresponds to the board with version v0.2. The figure below presents two photos of version v0.2, one from the front side and, another, from the back side. As a prototype version, most of the components are mounted in small boards connected to a base board. The components were transferred to the base board as the components were stabilized in the solution.
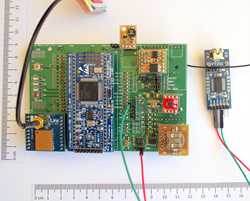
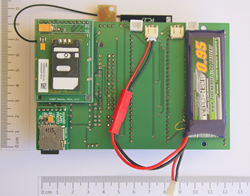
Subsystem 1 consists of the following components/modules:
- MEMS accelerometer (micro-electro-mechanical systems) to detect movement;
- RTC (real time clock) to implement a calendar and set alarms;
- 3.3V converter to power components of subsystem 1;
- MOSFET driver controlling the POWER MOSFET for the establishment of subsystem 2 power;
- POWER MOSFET that establishes or interrupts subsystem 2 power.
Subsystem 2 consists of the following components/modules:
- Microcontroller module to manage the application logic of the system;
- GSM module for communications having been used only the SMS component;
- GNSS module for the acquisition of geographic coordinates;
- Micro SDCard module to implement a Log system;
- Temperature sensor;
- E2PROM for saving system settings;
- 3.3V converter to power subsystem 2 components;
- Queue with 4 LEDs to identify the current state of the system.
Tests
The main goal of the tests was to perceive the impact that the different modes of operation of the system have on the overall consumption of the system. Operating modes correspond to surveillance, monitoring and tracking mode. In surveillance mode only subsystem 1 remains powered and in monitoring and tracking modes the two subsystems are powered. In addition to the main goal, the tests also allowed to determine the error associated with geographic coordinate readings, the battery charge value that compromises the operation of the system and to validate the behavior of the equipment in a tracking process.
This post presents three tests of the set of tests performed. These tests were performed with the hardware in version v0.2. For each test, we present the conditions under which the test was performed, the concrete objective of the test and the results analysis. Some tests included software development related to their implementation.
Test 1
This test evaluates equipment consumption in a mode equivalent to monitoring mode. For this test, a specific program was developed that performs the following cyclical actions:
- Connects and registers the GSM module on the cellular network;
- Records the value of the battery charge on memory card;
- Disconnects the GSM module from the cellular network;
- Re-records the battery charge value on a memory card.
The program remains running until the battery drains completely. Geographic coordinates are not collected, however, the GNSS module remains active and producing NMEA messages, so the consumption introduced by this module also contributes to battery discharge. The test was performed with a fully charged battery with a capacity of 1Ah and 20C of discharge. As a curiosity, a 1Ah battery means that a full charge can charge a current intensity of 1A for 1 hour and the 20C discharge value means that the battery responds to current requests up to 20x1A, i.e. 20A.
The table below shows the values collected by the program corresponding to the lowest and highest battery charge value, the total number of records on the cellular network successfully and without success, and the duration of the test. The values shown as battery charge in the table and in the next graph correspond to the values read by the ADC (Analog to Digital Converter) with 12 bits of precision through a voltage divider to the battery terminals. For example, the value 3600 corresponds to 4.2V, situation of a fully charged battery and the value 2900 corresponds to 3.4V, situation of a battery at the end of charge.
| Battery | Bat min | Bat max | OK rec | KO rec | Time |
|---|---|---|---|---|---|
| 1Ah, 20C | 2910 | 3604 | 1340 | 59 | 9h46 |
The chart below illustrates the battery charge values collected during testing. The axis of the abscesses represents the time in hours and the axis of the ordinates represents the battery charge values. Two lines are shown in the graph: one for the values collected after connecting the GSM module on the cellular network and the other for the values collected after disconnecting the GSM module from the cellular network. Please note that the cellular connection corresponds to a time when increased battery availability is required (the GSM module may require up to 2A in the cellular connection process).
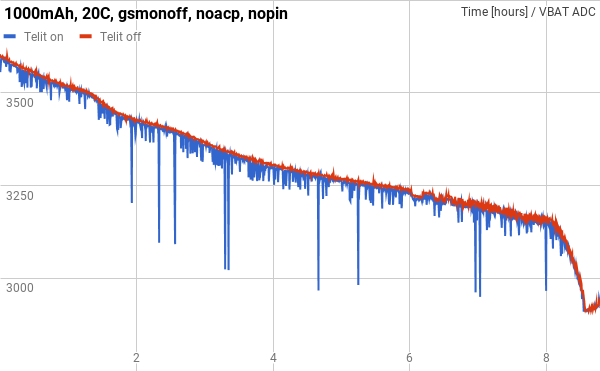
The graph denotes the normal behavior associated with the discharge of a battery, namely the “knee” effect verified when the battery charge is coming to its end (3150).
With the results of this test, it was collected the reference value from which the connection to the cellular network is no longer possible. The value 3200 was considered to allow the correct functioning of the system for 1 hour in the trace mode. This reference value is used by the control application to notify the user that he needs to recharge the battery.
Another value determined with the results of this test is the average current consumption in this mode of operation, corresponding to 125mA. Note that the monitoring mode corresponds to a system mode of operation that runs sporadically with an expected period of at least 24 hours.
Test 2
This test exposed the system to an environment close to a real scenario. To this end, the equipment was placed inside a hive (without bees) outside. The main features of the test include:
- Static equipment during testing;
- Battery 0.95Ah, 25C, fully charged;
- Monitoring cycle of 48h;
- Sending an SMS message for each monitoring cycle with geographical position, battery charge value, GSM card balance and temperature obtained through a temperature sensor.
This test aimed to reassess the consumption of the system, determine the average time to acquire a valid geographical position and the error of the geographical position provided by the GNSS module related to the installation position of the system. The same test was performed with a 24-hour monitoring cycle to assess the impact on the time of acquisition of a geographical position.
During the execution of the test, the system remains mostly in surveillance mode by transitioning to monitoring mode to meet a monitoring cycle. The length of stay in monitoring mode depends essentially on how long it takes the system to register on the cellular network and the time it takes to acquire a valid geographical position. From the tests performed, it was found that the time to acquire a geographical position is the time that has the greatest impact on the length of stay in monitoring mode.
It was verified through logs recorded on memory card in the equipment that the average time to acquire a valid geographical position is in the 3 minutes. To achieve this relatively short time when compared to the time achieved in other differentiated tests contributes to the fact that the monitoring cycle is always being carried out at the same time of day allowing the system to have in line of sight always the same satellites accelerating the calculation to determine the geographical position. There were no significant differences in the time of acquisition of geographic position between the 24-hour and 48-hour cycles.
For the geographical positions provided by the GNSS module, no position exceeded more than 50 metres in relation to the installation position of the equipment. The figure below shows 40 points flagged on the map corresponding to acquisitions of geographical positions and the position of the equipment under test.
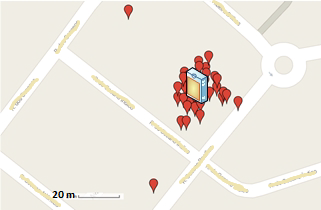
Based on the results of this test it has been determined that a geographical position provided by the equipment with a difference of 100 meters relative to its installation position represents that the equipment is being or has been moved from its installation position.
During the performance of this test, unforeseen events arose that compromised the analysis of equipment autonomy.
Test 3
The third test presented in this post validates the behavior of the equipment in trace mode. The equipment was put into operation on a trip from Algarve to Lisbon. The figure below shows the route made based on the geographical positions produced by the equipment in tracking mode and recorded on a memory card.
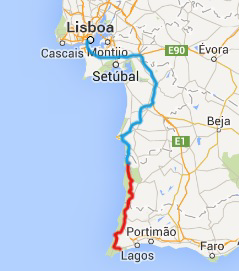
The image was produced through the GPSVisualizer application. This type of applications that draw paths on maps based on geographical positions typically receive a file in GPX (GPS Exchange Format). The file was generated based on the recorded geographic coordinates.
In the image, the path drawing appears in two colors because a stop was made during the trip at the point corresponding to the color transition that took long enough for the equipment to transition from tracking mode to surveillance mode. As soon as the trip resumed, the equipment returned to trace mode.
Next post: adventure’s history of a test in a real hive (with bees).